Generating Product Comparison Infographics
About
ChatGPT can help generate product comparison infographics that are both informative and visually appealing. With its vast knowledge and language generation capabilities, ChatGPT can help turn data into eye-catching images that can be easily understood by audiences of all levels. Say goodbye to boring spreadsheets and hello to attractive infographics!
Prompts
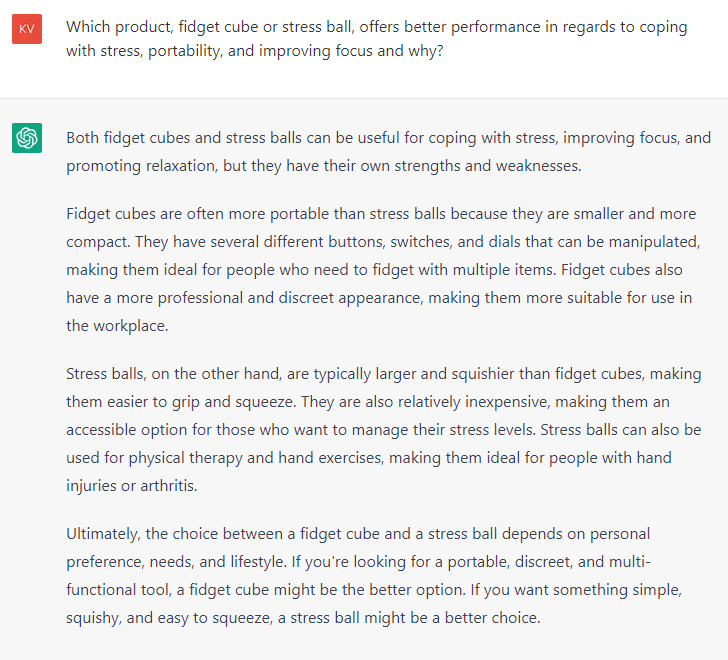
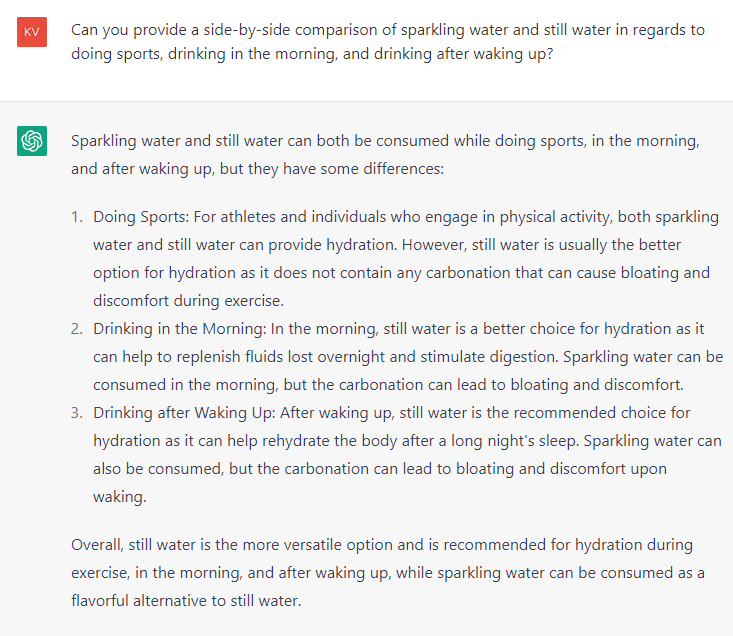
"Which product, [product A] or [product B], offers better performance in regards to [feature 1], [feature 2], and [feature 3] and why?""What are the key differences between [product A] and [product B] in terms of [feature 1], [feature 2], and [feature 3]?""Which one is better, [product A] or [product B], and why in terms of [feature 1], [feature 2], and [feature 3]?""What makes [product A] a better option compared to [product B] when it comes to [feature 1], [feature 2], and [feature 3]?""Can you provide a side-by-side comparison of [product A] and [product B] in regards to [feature 1], [feature 2], and [feature 3]?"Examples
Tips
💡
Be specific: To get more accurate and detailed information, be specific in your questions. Mention the exact products and features you want to compare.
💡
Use clear and concise language: Use simple language that can be easily understood to avoid confusion and misinterpretation.